Looking for some help or information about Bokken?
Here you have information about different topics such as installation, basic usage or features available.
Installation Execution UsageIf haven't done it yet, first go to the download section to get and install Bokken
DownloadIf you already have Bokken and all its dependencies installed then it's time to start using it. Depending on the platform you are using, the scripts to launch Bokken will differ but, for both platforms, you can choose to launch them with or without parameters.
Valid parameters are this binary format files:
If you are a Linux or OS X user, the command to start Bokken is the bokken bash script. Just launch it from the terminal or double click on the script if you are on a graphical file browser:
Examples:
./bokken
./bokken path/to/file
For Windows users the process is almost the same as in Linux. The file you must launch is bokken.bat but, before launching it, review and edit its contents to adapt them to your installation:
echo Modify this script for you
python.exe c:\Program files\bokken\bokken.py
You can also start the script with the same parameters shown in the Linux section above.
Back to topBokken has the ability to detect and analyze PE/Elf/mach0 files so, when one of those file formats is detected, the GUI shows all the information found on the analysis and offers many additional options to study the file.
Let's take a look at the main window once one of those files is loaded:

Overview of the first Bokken launch after analyzing the target binary
Let's view in depth some of the main interface elements

At the top of the window are the top buttons that allows to:
The first button, the one with Bokken logo, contains the all the configuration options and interface actions common to all target formats, like open and save targets, change GUI appearance or open the help are some of the available options accesible from this menu.
The rest of the interface can be divided in two additional areas: the left and right panels.
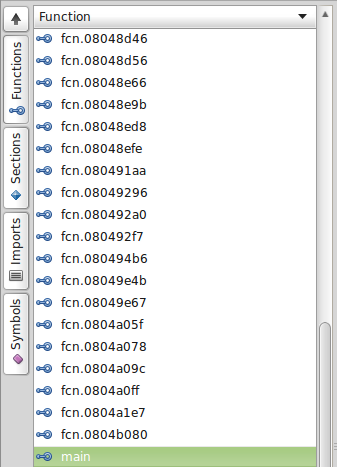
The left panel contains different parsed information extracted from the file, in this case:
For all them you can double click in one element and it will be highlighted on the right panel.
By right clicking and selecting Go to you can get the same result, or, if you choose Show graph instead, the graph tab will be updated.
The right panel is where the actual data of the file is shown and it is divided in many or tabs. Let's see the different tabs available:
In this view the executable sections of the file are disassembled or, if no executable sections are found, the whole file starting at offset 0.
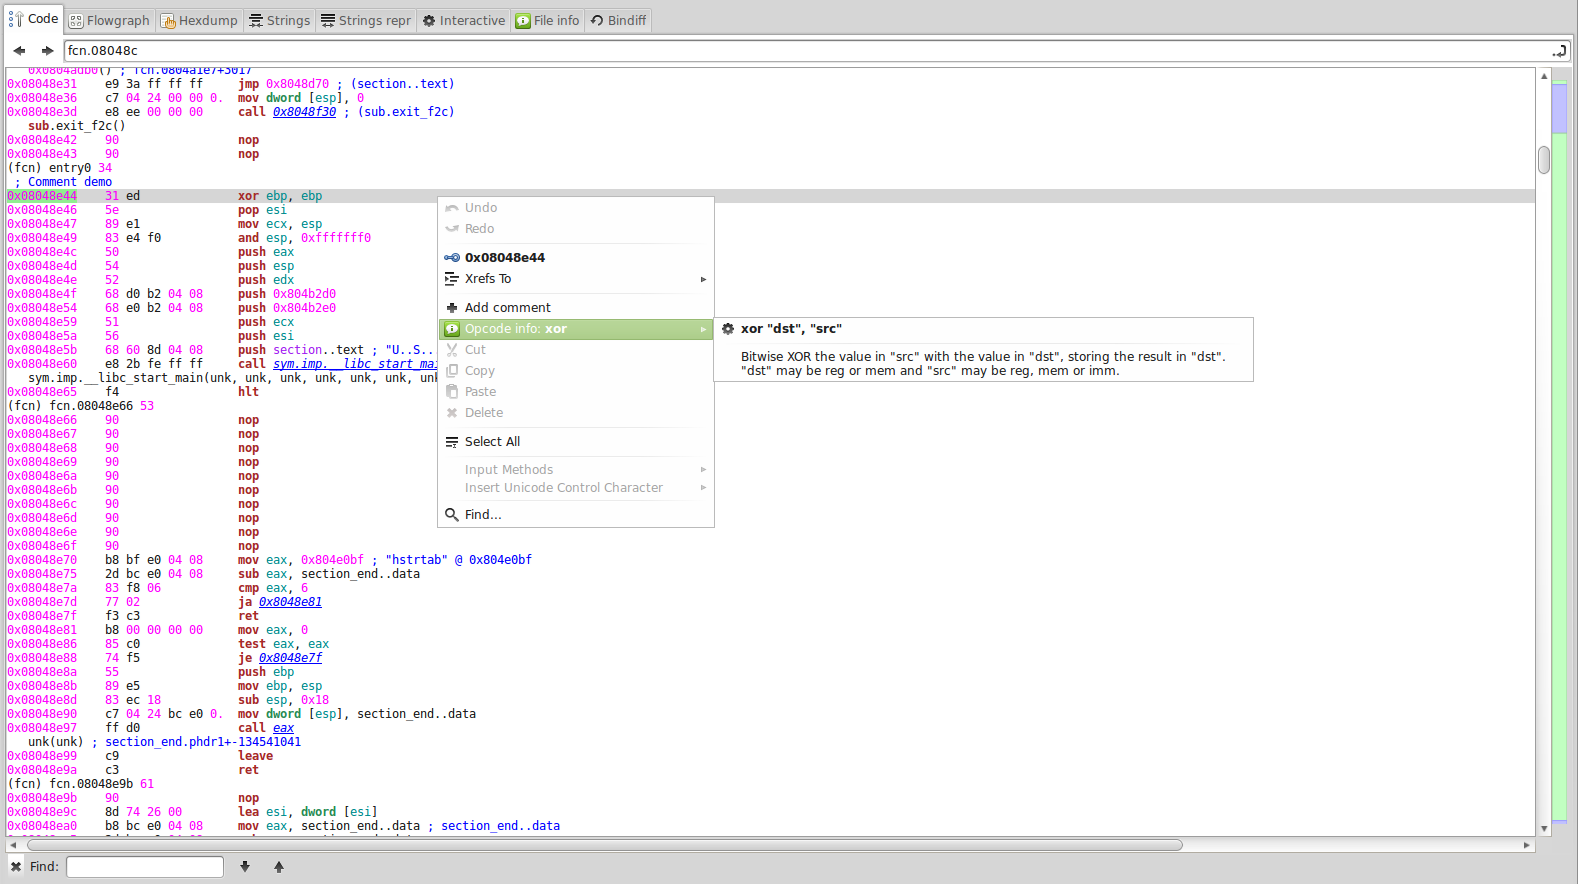
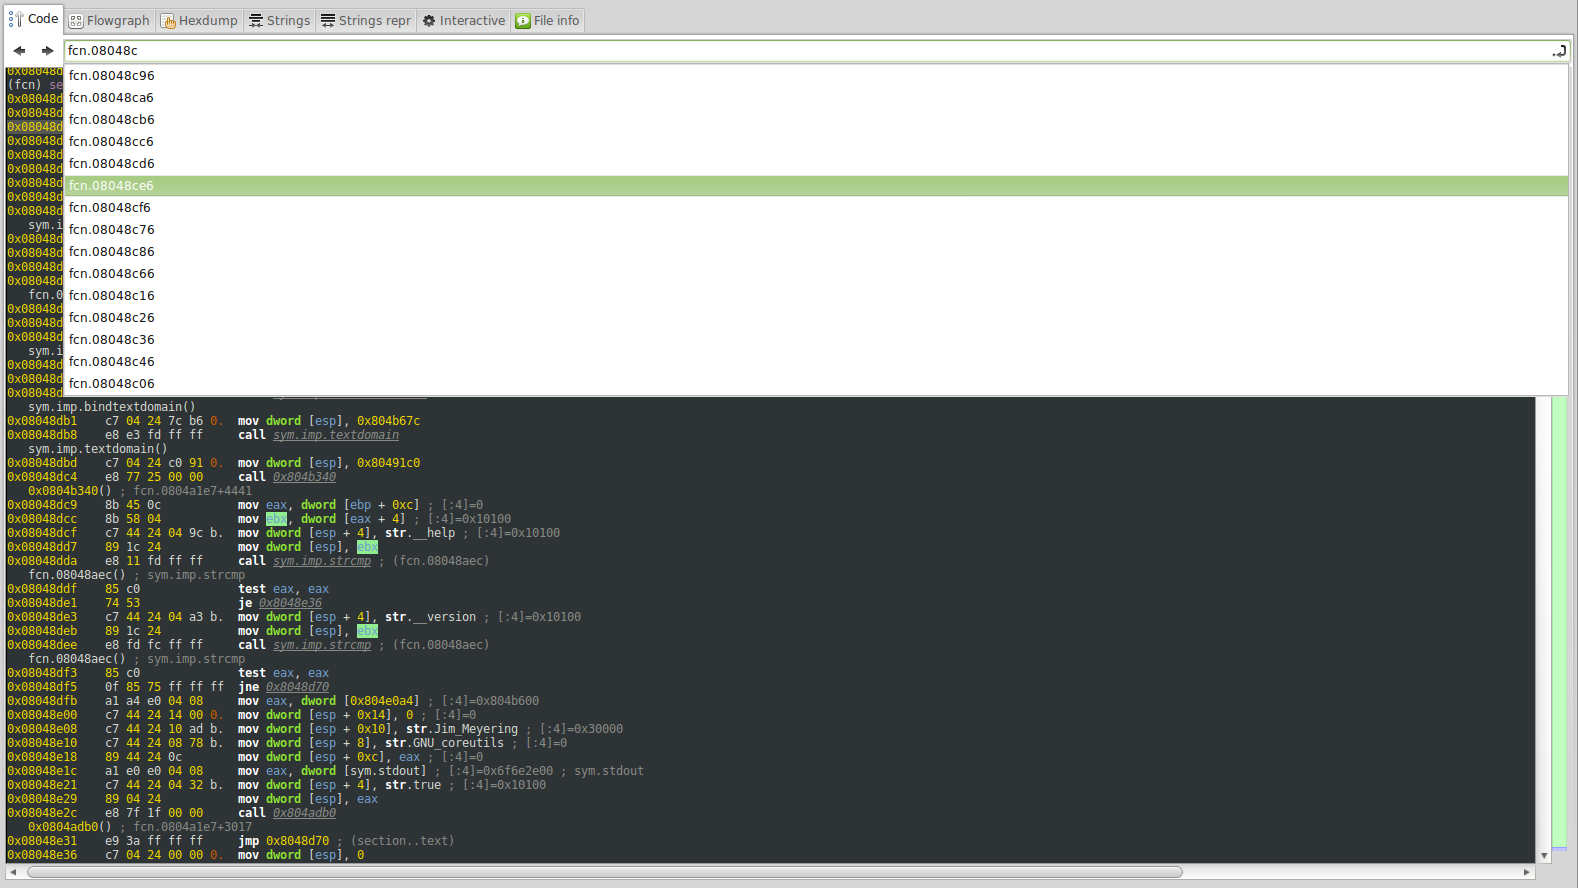
Code navigation works by clicking on underlined code and, sometimes, even clicking on non-underlined code. The top bar with the arrow buttons and text entry can be used to go forward and backward on the navigation history and to seek directly a function or basic block by typing a name.
Also additional features can be found by right clicking on the code; those features can be:
Finally the code tab has a right color bar aside the scroll bar; it's the sections bar and shows the different sections disassembled, their length and the relative position of the actual code beeing shown if compared with the scrollbar.
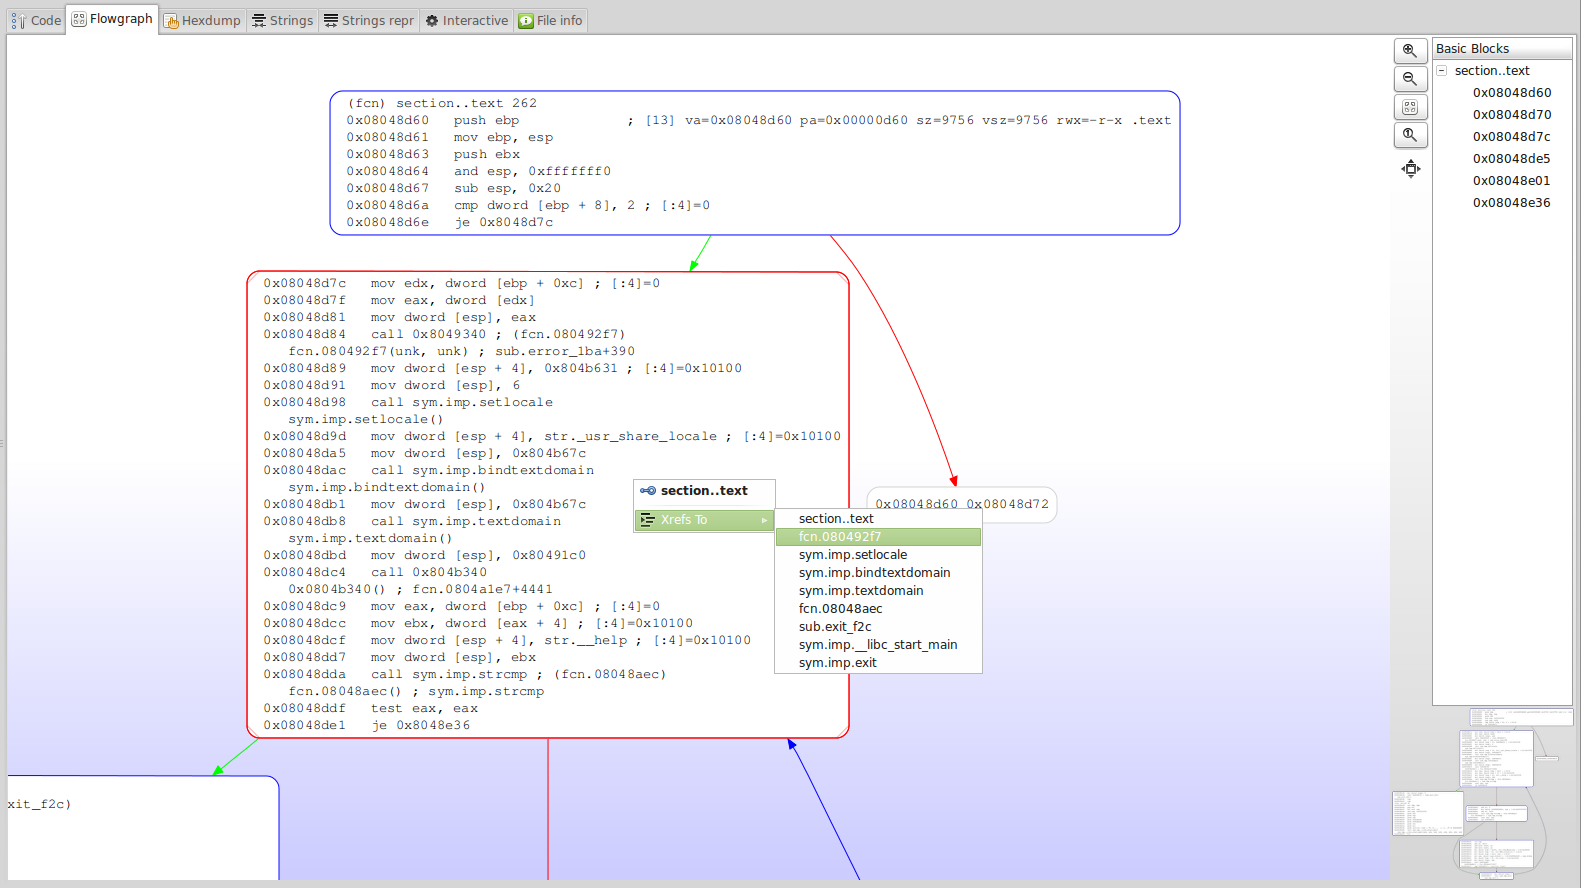
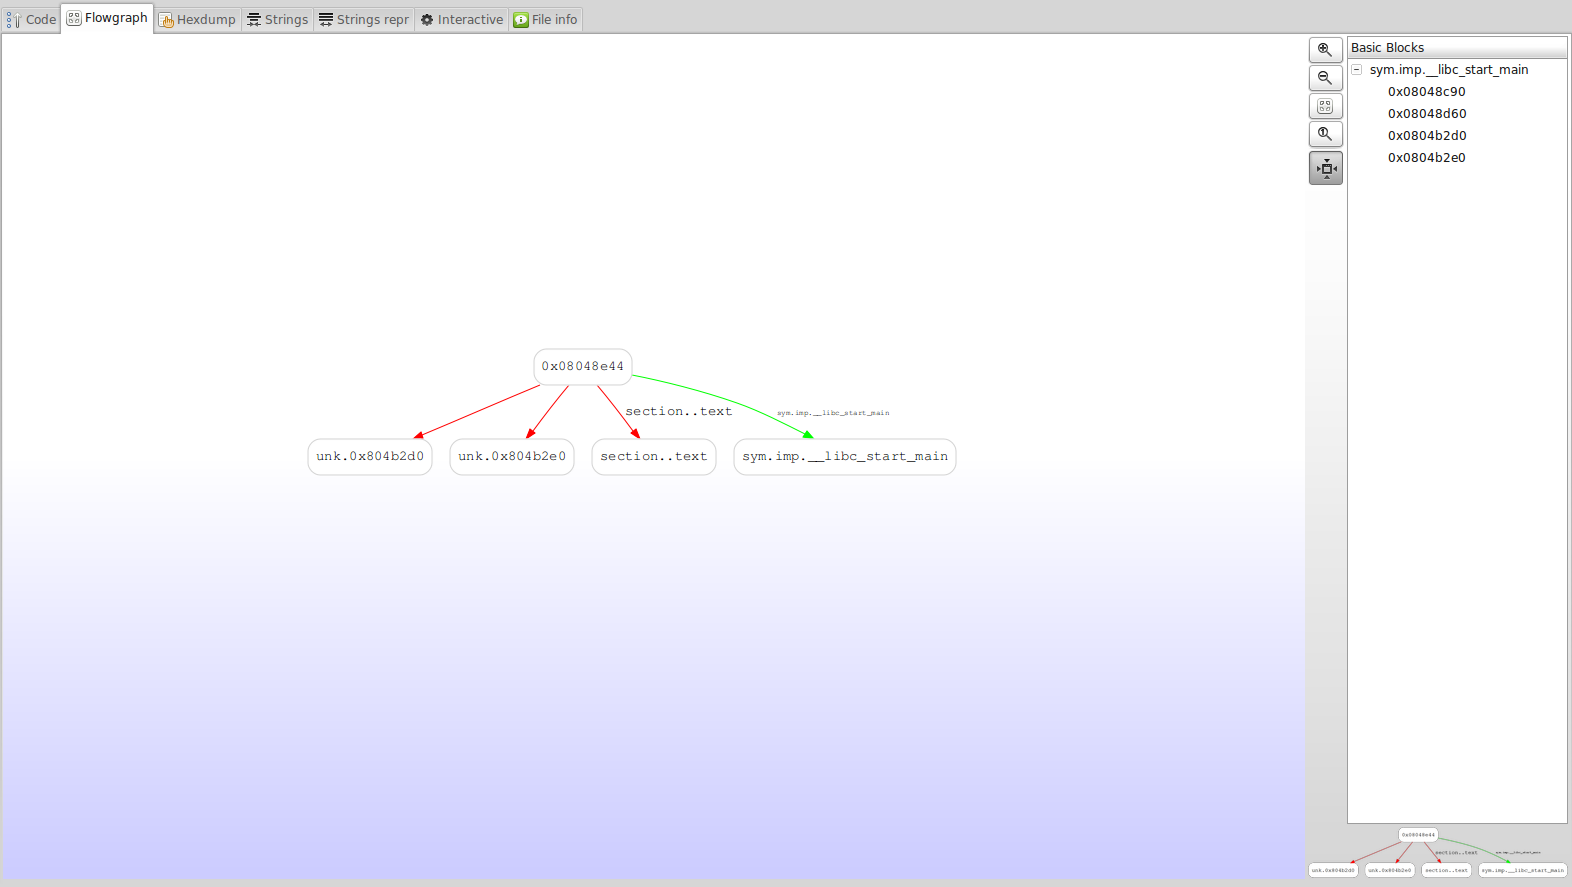
In this tab the flowgraph of the selected funcion will be shown:
The right tree shows the basic blocks of the function that, if double clicked, will move the graph to the selected basic block.
If right clicking over a graph node, a popup menu will show the Xrefs to and from for the current function.
Finally, the last button of the graph bar will switch between flow and call graphs of the current function:
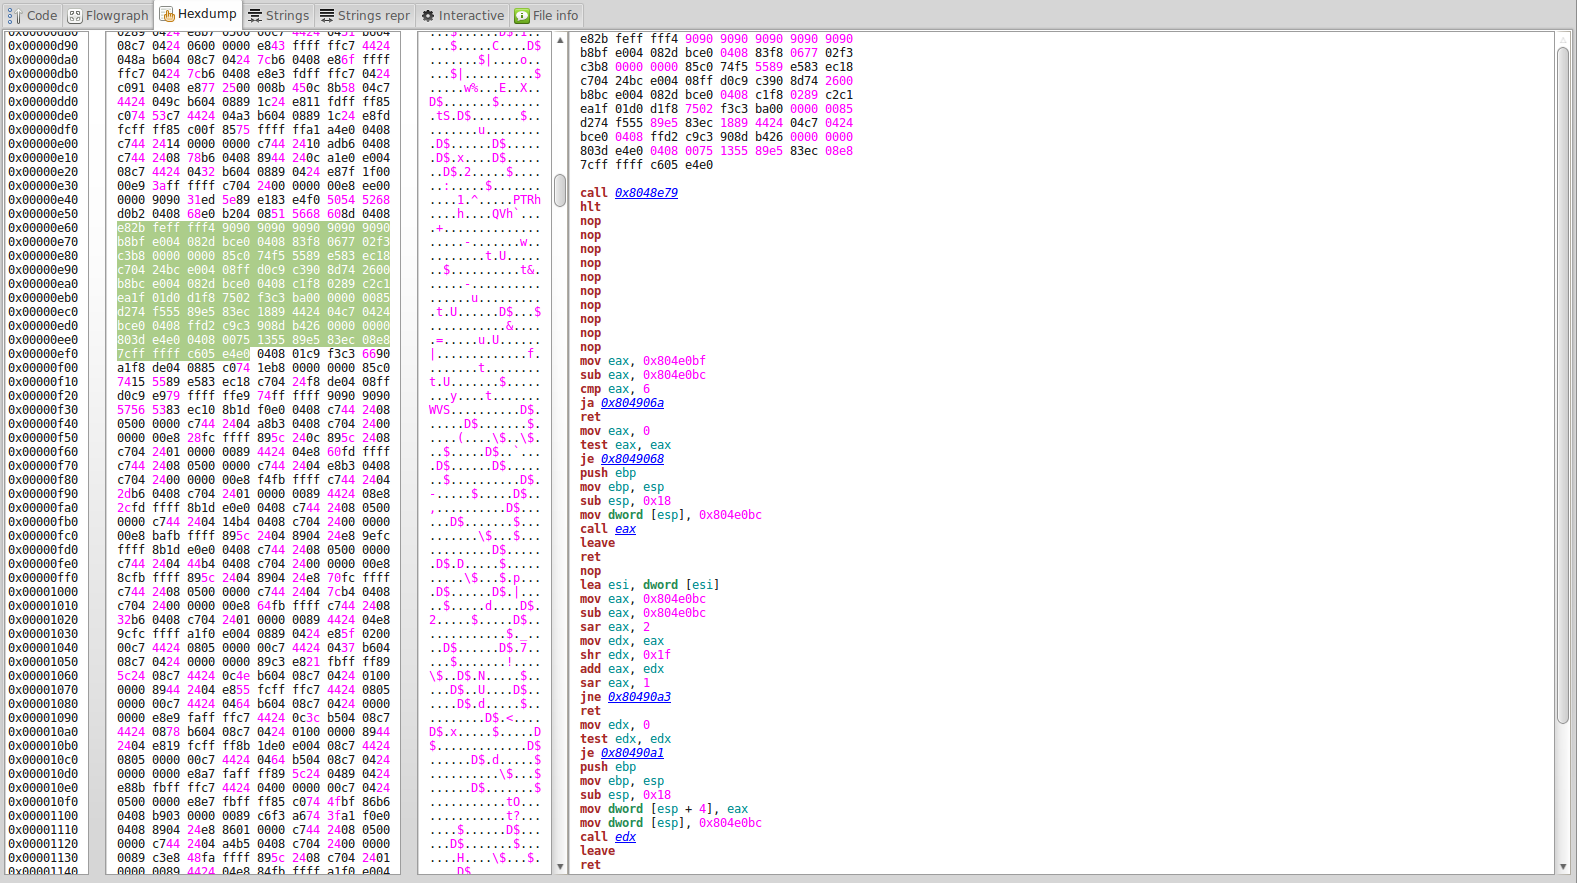
At the moment this view just shows the hexdump of the entire file without allowing (yet) editing the contents.
If some bytes are selected on the hexdump, the disassembly of these bytes will appear at the right text area of the view.
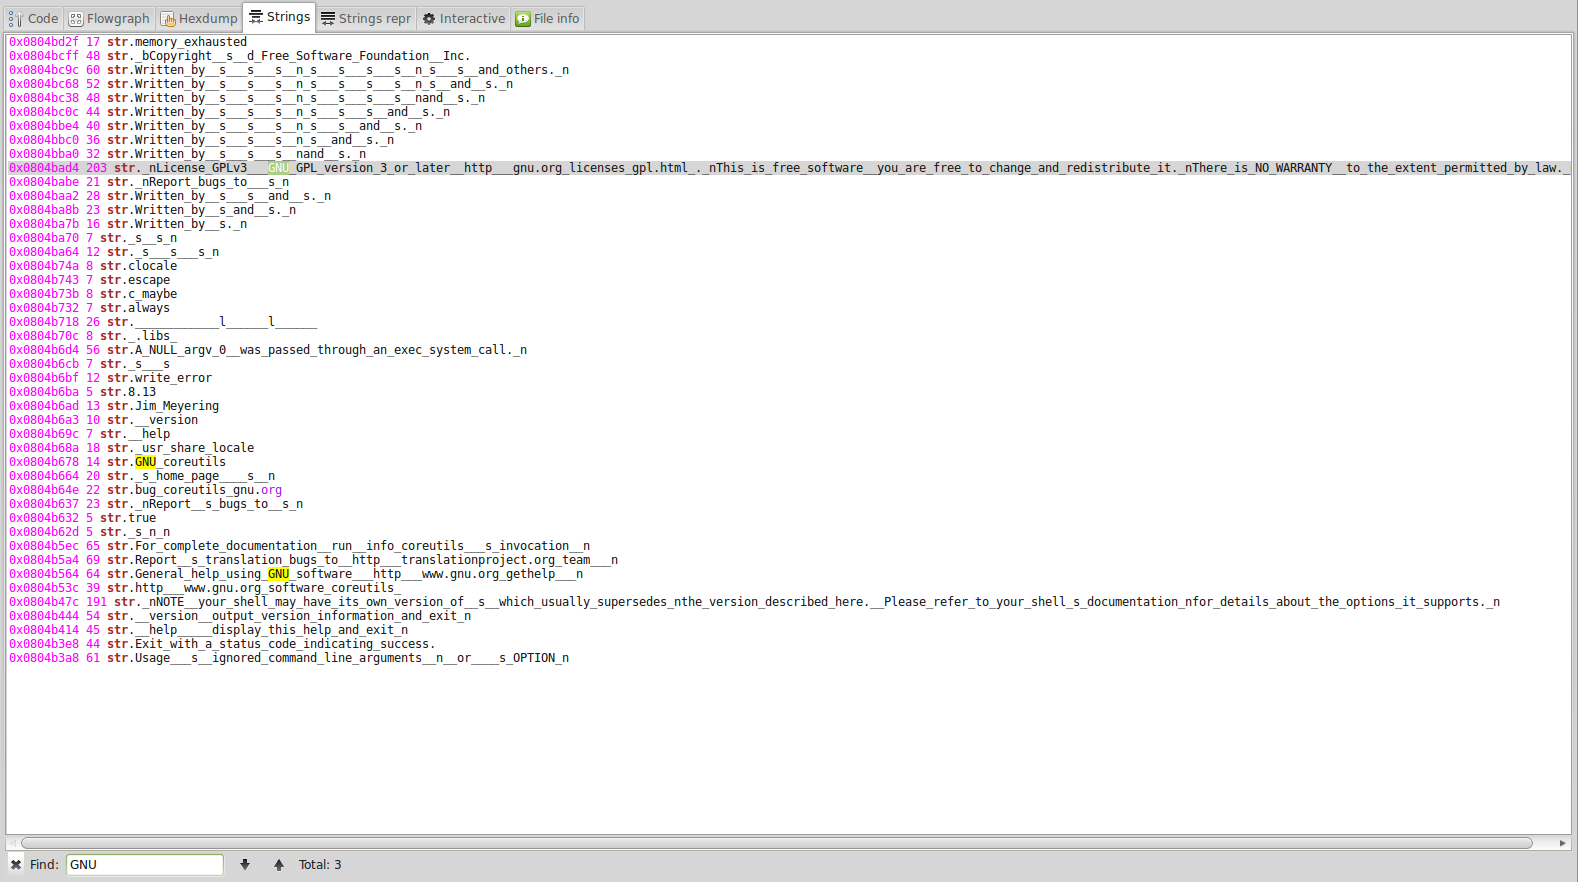
This view shows all the strings found in the file along with their offset.
All the views have a search panel that can be invoked with the key binding "Ctrl + F" and if clicked the string will be searched on the code tab.
Interactive view is a special view that allows you to move along the file in different ways.
At the bottom of the Interactive view there is a collection of controls that allow you to:
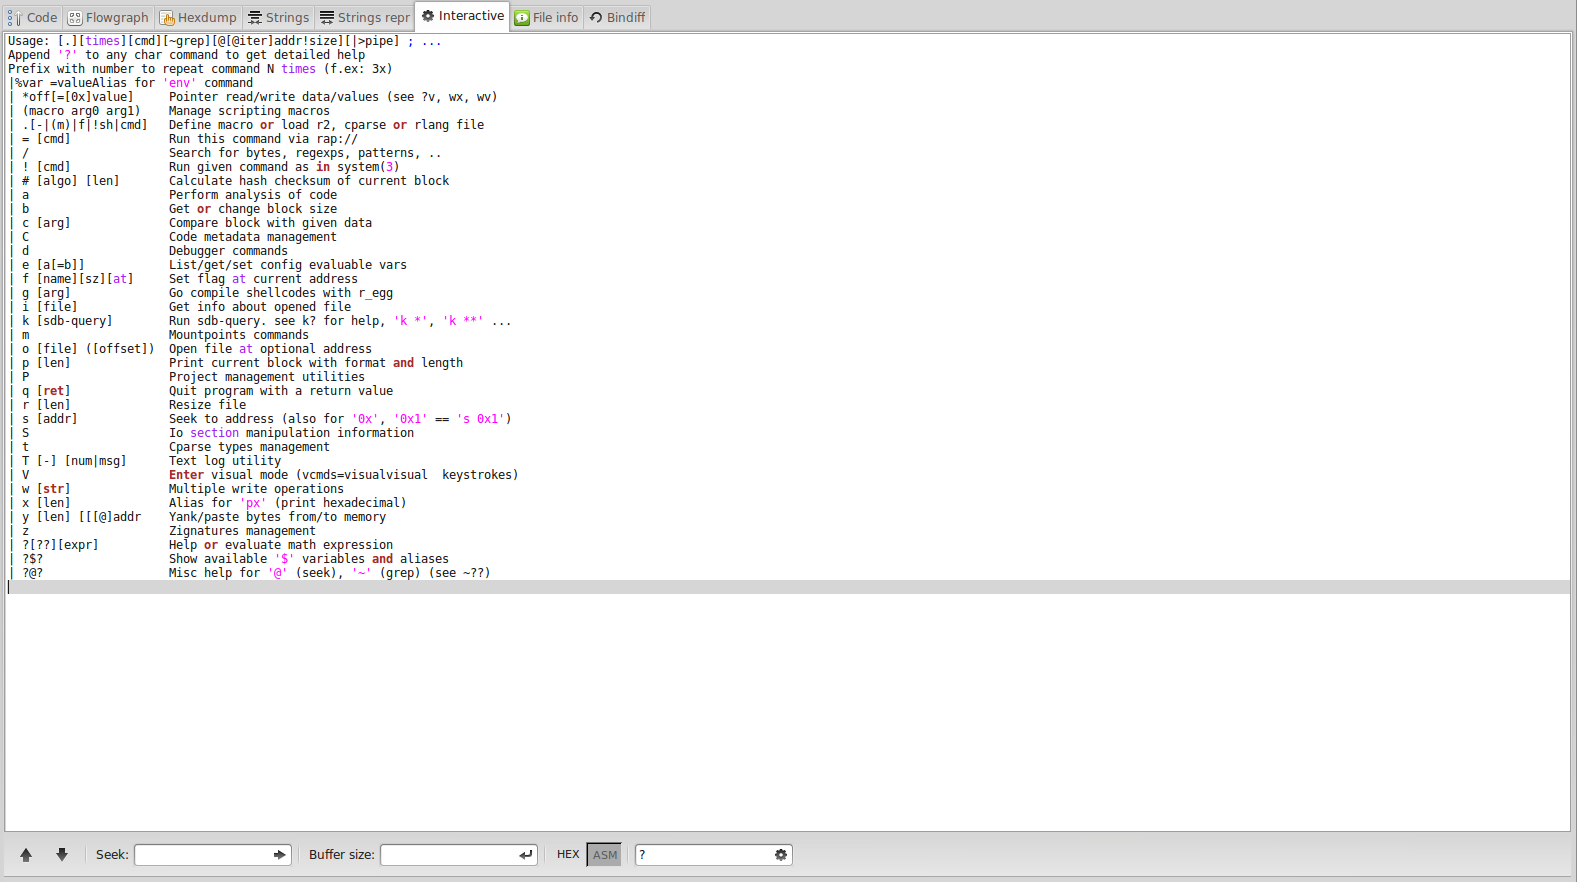
If you focus on the text view of the interactive mode some key bindings are available:
It shows a detailed view of the target information:


At the bottom of the window the status bar shows relevant file information as:
 Bokken